The Premium Is the Headline, Not the Whole Story
When shopping for insurance, the monthly premium is usually the first number you see - and for good reason. It's predictable, recurring, and easy to compare. But focusing only on the premium is like judging a loan by its monthly payment without looking at the interest rate or term length.
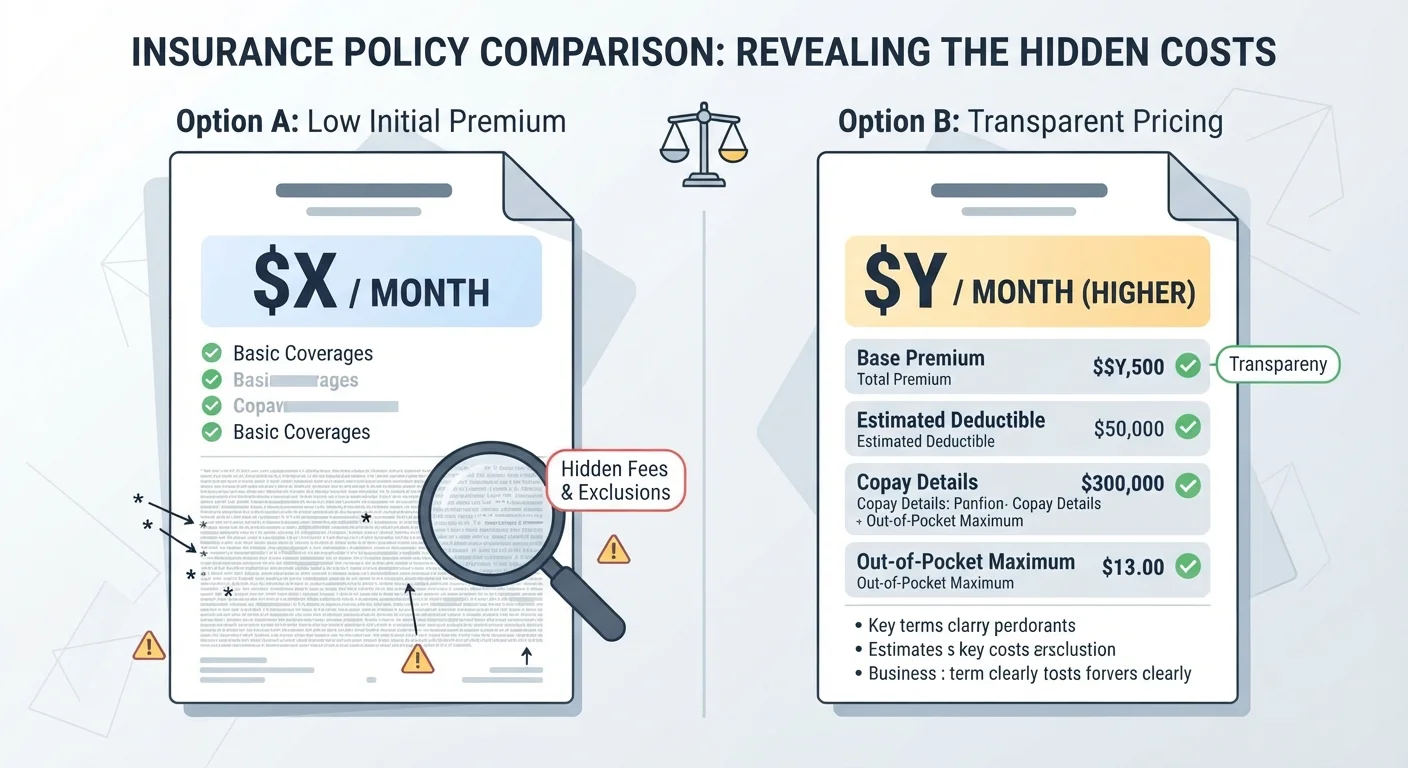
Every policy also includes cost-sharing features: the deductible (what you pay before coverage applies), copays (fixed fees per visit or service), coinsurance (your percentage share of costs after the deductible), and the out-of-pocket maximum (the ceiling on what you'll pay in a year). Together, these determine how much coverage actually costs when you use it.
Understanding each of these terms clearly is the first step toward reading a policy's real price tag.
$1,763
Average individual health plan deductible (employer-sponsored, 2023)
According to KFF's 2023 Employer Health Benefits Survey, average single-coverage deductibles for employer plans have risen significantly over the past decade.
$9,450
ACA out-of-pocket maximum for an individual (2024)
The IRS sets annual limits on out-of-pocket maximums for ACA-compliant health plans; for 2024, the individual limit was $9,450, representing the most a covered person could owe in that plan year.
43%
Adults who struggle to afford unexpected medical bills
A Kaiser Family Foundation survey found that roughly four in ten U.S. adults report difficulty affording unexpected medical costs, illustrating the real-world impact of high cost-sharing.
How Low Premiums Get Offset by Higher Cost-Sharing
Insurers generally offer lower premiums in exchange for you taking on more financial risk. This risk transfer works through two main levers: a higher deductible and higher coinsurance.
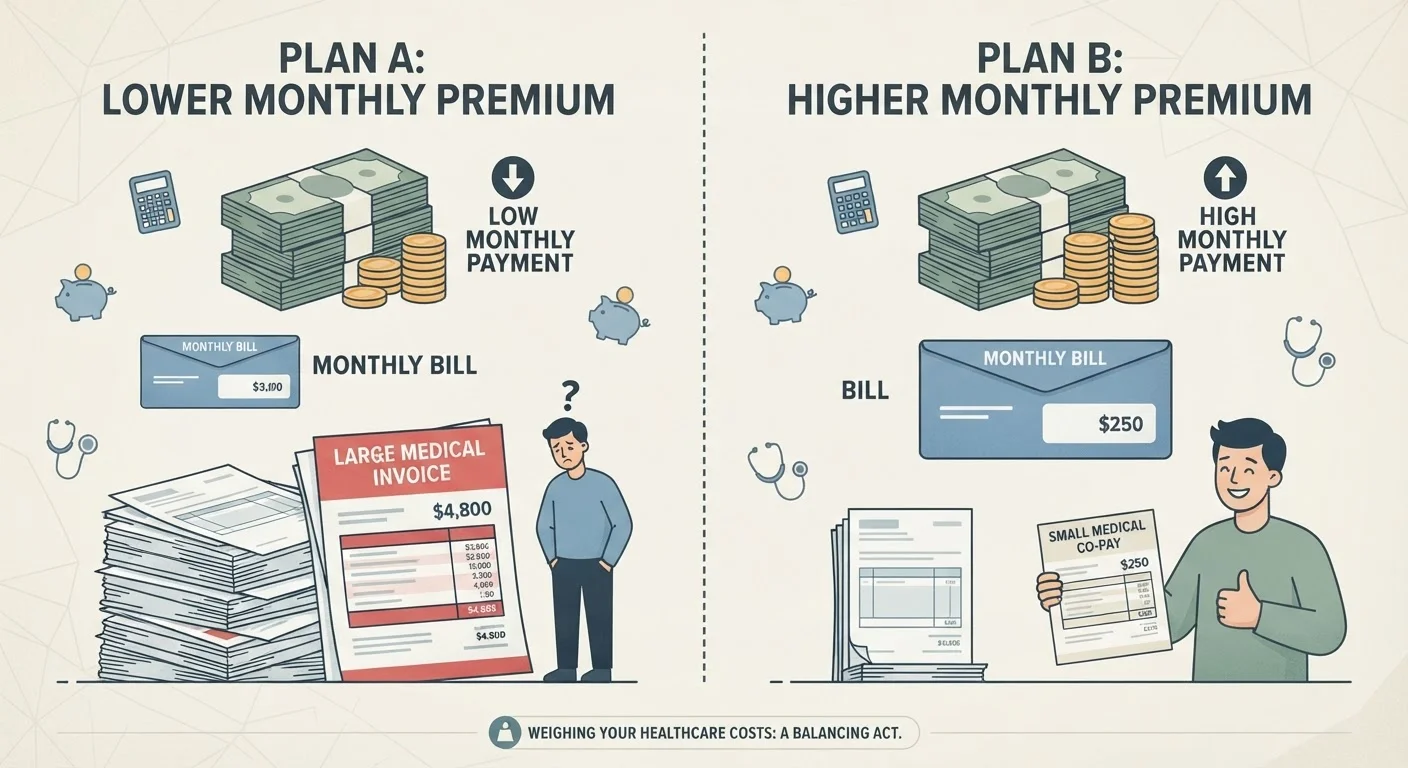
Suppose Plan A costs $180 a month with a $1,000 deductible and 20% coinsurance. Plan B costs $280 a month with a $250 deductible and 10% coinsurance. If you go a full year without a major claim, Plan A saves you $1,200 in premiums. But if you face a $10,000 covered expense, Plan A could cost you $1,000 in deductible plus $1,800 in coinsurance (20% of the remaining $9,000) - a $2,800 out-of-pocket hit versus $250 plus $975 under Plan B.
This is not a flaw in Plan A. It's a deliberate structure. The question is whether your financial situation can absorb that kind of variable cost. Weighing those real trade-offs depends heavily on your usage expectations and savings cushion.
Run a Best-Case and Worst-Case Estimate
Before choosing a plan, calculate your annual cost under two scenarios: one where you barely use coverage, and one where you hit your out-of-pocket maximum. If the low-premium plan becomes dramatically more expensive in the worst-case scenario and you don't have savings to cover it, a higher-premium plan with lower cost-sharing may be the sounder financial choice.
Scenarios Where the 'Cheaper' Plan Costs More
The math shifts depending on how often you use your coverage. Consider two common situations:
- Frequent use: If you visit a specialist regularly, fill prescriptions monthly, or have a chronic condition, higher copays and coinsurance accumulate fast. A plan with lower cost-sharing may end up less expensive overall even if the premium is higher.
- Single large event: An unexpected hospitalization, major auto accident, or significant home repair can expose you to your full deductible plus coinsurance in one shot. A high out-of-pocket maximum on a low-premium plan can mean a five-figure personal expense.
High-deductible plans carry real financial risk that isn't always apparent from the monthly statement. It's worth running both low-use and high-use estimates before committing to a plan.
How to Calculate the Real Annual Cost of Any Policy
A straightforward way to compare policies is to build a simple annual cost estimate for each scenario you're considering:
- Calculate annual premium: Monthly premium × 12.
- Add expected deductible: How much of the deductible are you likely to meet based on typical usage?
- Estimate copays and coinsurance: Multiply expected visits or expenses by your share percentage.
- Check the out-of-pocket maximum: In a worst-case year, this caps your total exposure - but note how high that ceiling sits.
Comparing these totals across plans gives you a far more honest picture than premium alone. Keep in mind that common pricing myths can lead consumers to skip this step entirely - and quietly overpay year after year.
For questions specific to your situation, a licensed insurance agent or a qualified financial adviser can help you model these numbers against your actual circumstances. This article is for general informational purposes only and is not personalized insurance or financial advice; coverage terms, costs, and regulations vary by provider and state.
Always review the actual policy documents and consult a licensed professional before making any coverage decisions.